
In almost every planning process, there’s a moment when the room goes quiet. It usually happens when a map, diagram, or floorplan goes up on the screen. Suddenly, the conversation shifts—people see the patterns, the gaps, and the opportunities. Visuals have a way of making complexity feel simple, of helping stakeholders not just read about their food system but actually see it.
At New Venture Advisors, we’ve learned that the right visual can change the course of a project. A map, a schematic, or a network diagram takes information that might feel overwhelming in a report or spreadsheet and turns it into something instantly clear. These tools help stakeholders understand what’s happening in their food system today—and imagine what could be possible tomorrow.
Maps: Grounding Strategy in Place
A good map does more than show locations. It tells a story about how geography shapes opportunity.
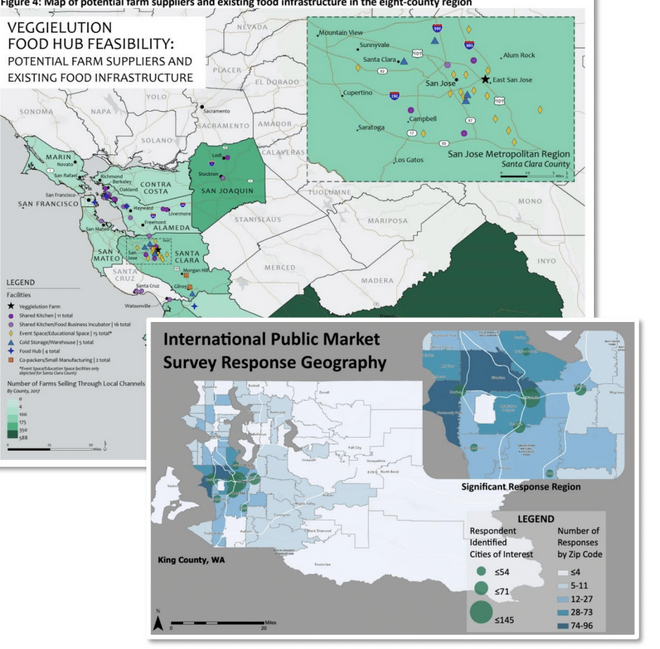
With GIS tools, we can layer infrastructure elements such as highways and market outlets on top of consumer demographics, farm data, and other relevant parameters. Suddenly, the gaps and opportunities pop into view: a cluster of producers that could be better connected to markets, a community where residents live far from healthy food options, or a transportation corridor that could become a backbone for distribution.
Maps also give us the power to test scenarios. What happens if a new facility is located here instead of there? How would creating distribution routes that connect cooperative networks affect efficiency? Where are population shifts and growth creating new demand? With drive-time analysis, heatmaps, and catchment area studies, we can model these possibilities and compare outcomes side by side.
For stakeholders, maps make it easier to move from debate to consensus. Instead of talking in the abstract about supply gaps or market potential, they can see it—and make confident, data-driven decisions together.
Graphics: Bringing Structures and Services to Life
All of us learn and process complexity in different ways. Graphics and diagrams are often the tools that help teams workshop through the implications of how new systems, services, and projects affect people.
At New Venture Advisors, we use graphics across food system plans, management strategies, business plans, and even pitch decks. They help project teams navigate complex processes like staffing roles, service design, and partnership development. A graphic might clarify the critical path of a partner’s role, show a funder the broader reach of a new program (and why their investment matters), or help an evolving partnership assess capacity before taking on new opportunities.
In every case, graphics bring structure and services to life. They make the moving parts visible so that stakeholders can see themselves in the plan and understand how their contributions connect to the bigger picture.
Schematics: Showing How Enterprises Work
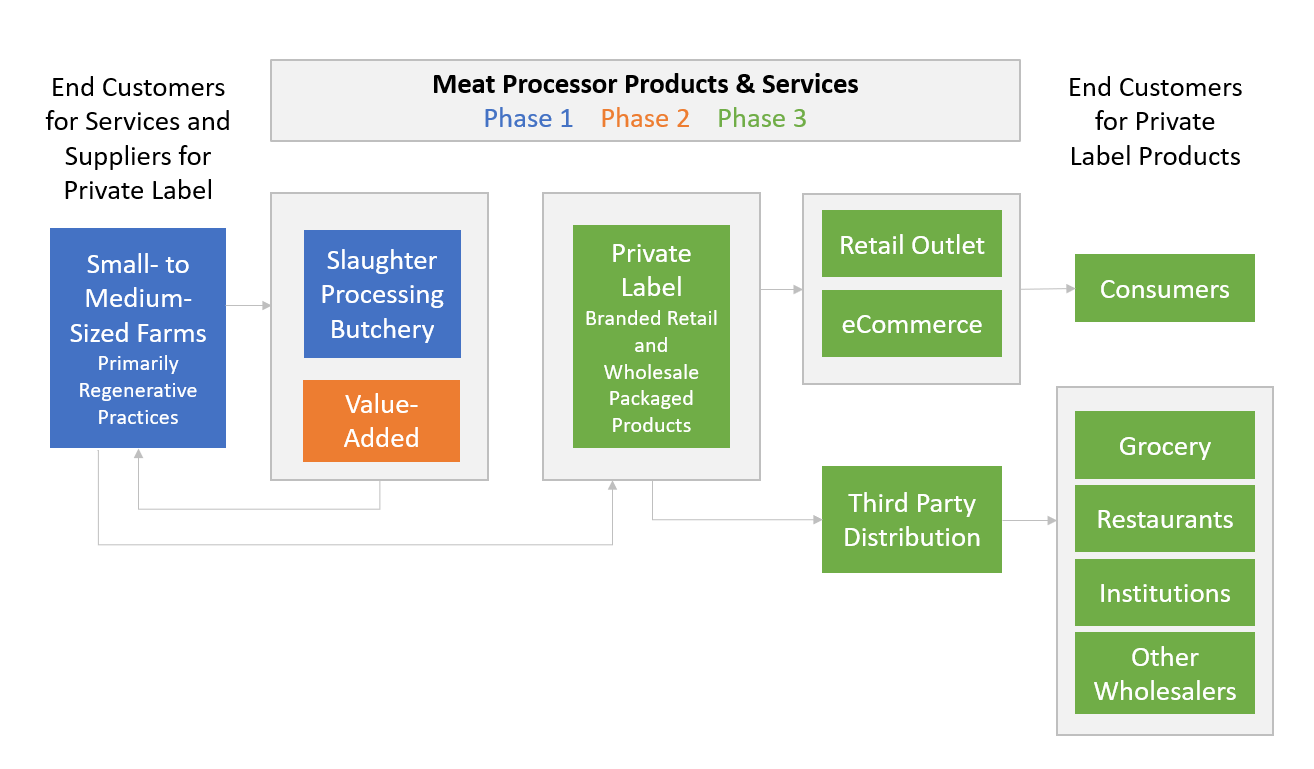
If maps explain where, schematics explain how. These diagrams trace the flow of people, products, and resources through an enterprise, clearly identifying how a facility’s design might be improved for efficiency, user experience, and improved outputs.
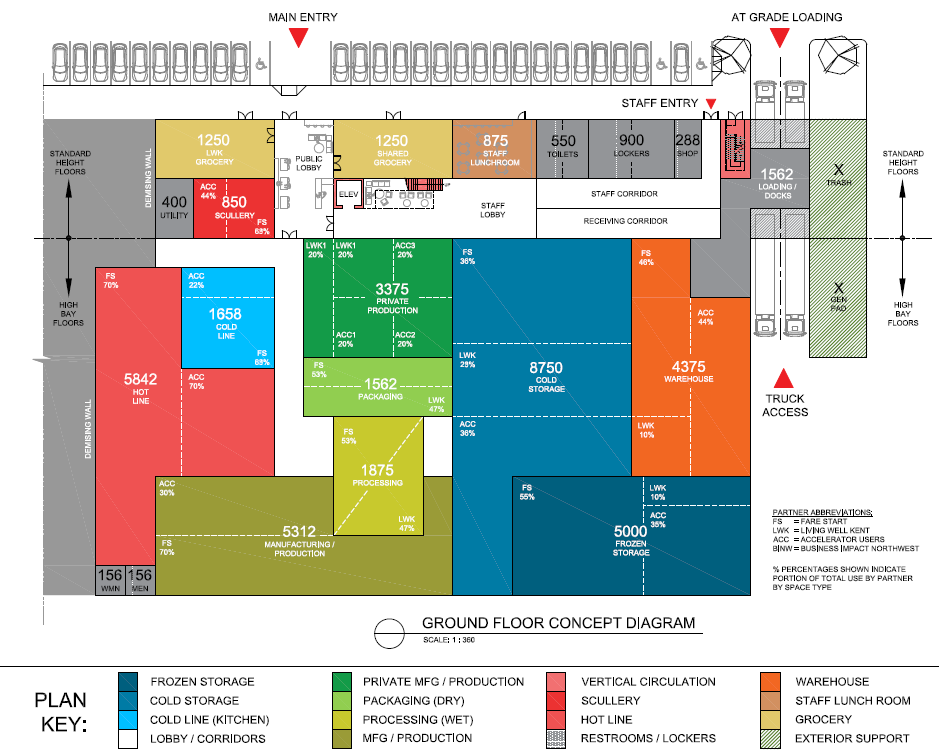
Take a food hub as an example. A schematic might show farmers supplying fresh produce, trucks delivering to a hub, staff sorting and packaging products, and goods moving out to grocery stores, institutions, or directly to consumers. It can be a a simple picture, but it reveals critical dynamics: Where are the bottlenecks? Are there underutilized corners and spaces? Where could partners help build more opportunities? Where will users need help or oversight from staffing?
Schematics like the featured image at the top of this post are also an invaluable communication tool. Funders, lenders, or policymakers may not have time to wade through pages of narrative about your business model. But when they can see the system drawn out, the logic clicks. They understand how the enterprise operates, how it creates value, and why it’s worth supporting.
In short, schematics make the invisible visible. They don’t just describe a plan—they show it in action, which builds confidence and alignment among everyone involved.
Social Network Mapping: Making Relationships Visible
Behind every food system are people and organizations—and the strength of their relationships often determines whether projects thrive or stall. Network mapping and social network analysis give those relationships shape.
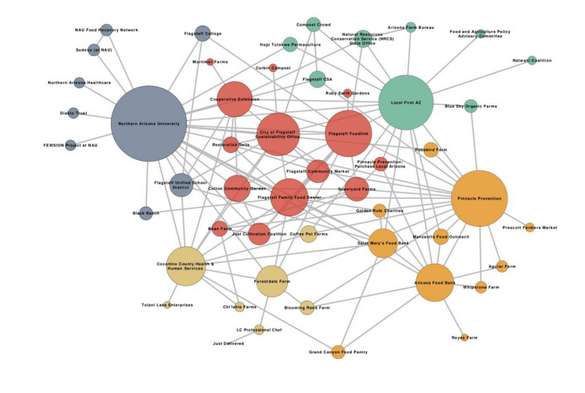
By visualizing the complexity of connections, we can see clusters of collaboration, identify key players, and pinpoint where gaps leave parts of the system under-supported. A network map might reveal that a handful of organizations are serving as bridges between otherwise disconnected groups, making them critical to communication and stability. Or it might show that a group of actors are isolated, suggesting that new partnerships could expand their impact.
When New Venture Advisors conducted a social network analysis in Flagstaff, Arizona, we helped the community see exactly these kinds of patterns. The map highlighted where strong collaborations already existed—and where building new ones could make the local food system more resilient. For community leaders, this wasn’t just an academic exercise. It was a roadmap for strengthening trust, building partnerships, and unlocking resources.
Network mapping is powerful because it shifts the perspective from individual actors to the system as a whole. It allows people to see themselves in the bigger picture and understand how their connections—or disconnections—shape outcomes.
Turning Analysis Into Action
Every food system has hidden strengths and untapped opportunities—it just takes the right lens to reveal them. Visuals give communities that lens. They show the paths forward, the partnerships waiting to happen, and the places where investment will matter most.
At New Venture Advisors, we use these tools because we’ve seen their power: they help communities see their food system clearly, so they can change it more effectively.
The next time you’re planning a food hub or community food project, ask yourself: what would it look like if you could truly see your food system?
Images by New Venture Advisors, courtesy of our clients